Understanding the Events Report
Events
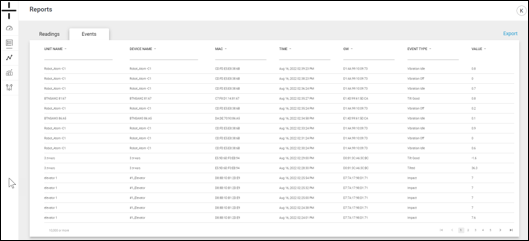
The Events Report contains the following information:
- Unit Name – this is the name of the Unit containing the device. The Unit Name and the Device Name are the same by default for the AT-U device type (the stand-alone unit). The Unit Name for the AT-R and AT-C Atoms is the name of their associated Gateway.
- Unit and device names are editable in the Management tab. Please see the Management Section of the manual for additional details.
- Device Name – this is the name of the device and is editable in the Management section of the dashboard
- MAC ID – this is the unique identifier of the Atom
- Time – this is the date and time that the sample was recorded
- GW – this is the MAC ID (unique identifier) of the Gateway for an associated AT-R or AT-C device. The MAC ID and the GW ID are the same for the AT-U (stand-alone)
- Event Type – The event type is determined by what caused the event. As examples, options include Temperature High, Impact, Vibration On, etc.
- Value – this is the recorded value from the sensor
This report can also be exported using the Export button in blue in the top right corner of the web page.
Using the Events Report

Events
The Events Report is another option for at-a-glance information on the events the Atomation platform has identified.
Use this report to quickly see which Atoms are reporting events and understand where attention should be focused. Use the sorting and filtering options at the top of each column to further refine the report.
This report is also the ideal starting point for further analysis. Using devices that are reporting events in the Graph Builder (covered in the next section of this manual) gives a deeper look into machinery that is triggering events in the Atomation platform.
