
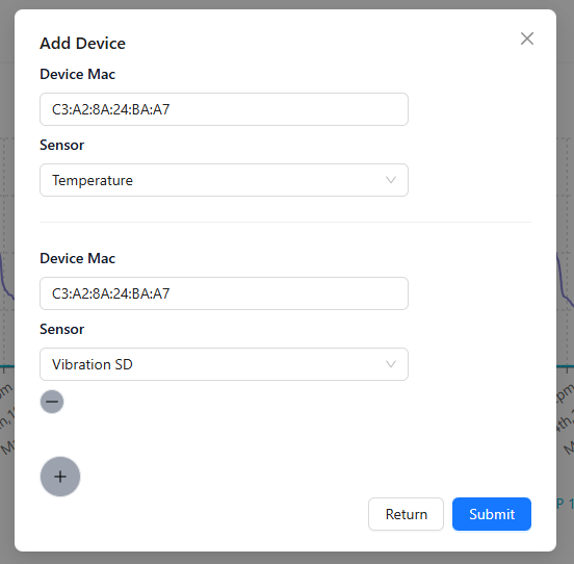
To add additional Atoms or sensor readings to the graph, click on the pencil icon and then the plus sign on the screen. Enter the Device name or MAC ID and the sensor and then click submit. The graph will update with the additional sensor readings.
Additional Notes
Once you’ve selected the devices and sensors to graph, the partial MAC ID and the sensor icons will show above the chart, showing what has been graphed.
Users can click on the MAC ID (next to the blue and red boxes in the graph) to eliminate that sensor from the graph. To restore the sensor, simply click on the MAC ID again and the graph will show both sensors again.
Users also have the option to switch between line and dot graphs by selecting the graph type.
User Tip: Be sure to always note the graph scale. Depending on the data requested, there may appear to be large variances when in fact, the variances are slight.