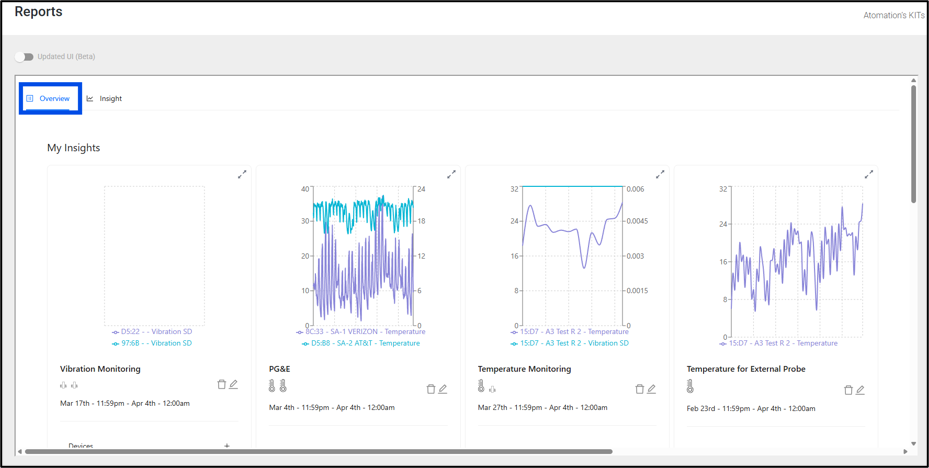
After clicking on the graph icon in the left navigation menu, users are directed to the Overview page. The Overview page will initially load as an empty page. The Overview page lets users add charts for the equipment that is most critical/that they wish to monitor closely. Up to eight graphs can be added to this page. Additionally, users can add up to 12 additional graphs to the Quick Links section below the main Overview area on this page.
In order to add a graph, first the user needs to navigate to the Insight tab.
