Home
Industrial Docs
Dashboard Quick Start Guide
Using the Dashboard
Industrial Installation Guide
Industrial Troubleshooting Guide
Utilities Docs
Dashboard Quick Start Guide
Using the Dashboard
Utilities Installation Guide
Utilities Troubleshooting Guide
Contact
Home
Industrial Docs
Dashboard Quick Start Guide
Using the Dashboard
Industrial Installation Guide
Industrial Troubleshooting Guide
Utilities Docs
Dashboard Quick Start Guide
Using the Dashboard
Utilities Installation Guide
Utilities Troubleshooting Guide
Contact
Dashboard Quick Start Guide
Home
5
Topics
5
Viewing Data: Create and Save Customer Graphs in Insights
Guide Content
Expand All
Chapters
Getting Started
1 Topic
Expand
Getting Started
Chapter Content
0% Complete
0/1 Steps
Logging in to the Web Portal
Using the Dashboard
2 Topics
Expand
Using the Dashboard
Chapter Content
0% Complete
0/2 Steps
Main Dashboard Elements
Viewing Data: Create and Save Customer Graphs in Insights
Common Tasks
3 Topics
Expand
Common Tasks
Chapter Content
0% Complete
0/3 Steps
Checking Device Status
Finding Device Setting Information
Setting Up Alerts
Viewing Data: Create and Save Customer Graphs in Insights
Dashboard Quick Start Guide
Using the Dashboard
Viewing Data: Create and Save Customer Graphs in Insights
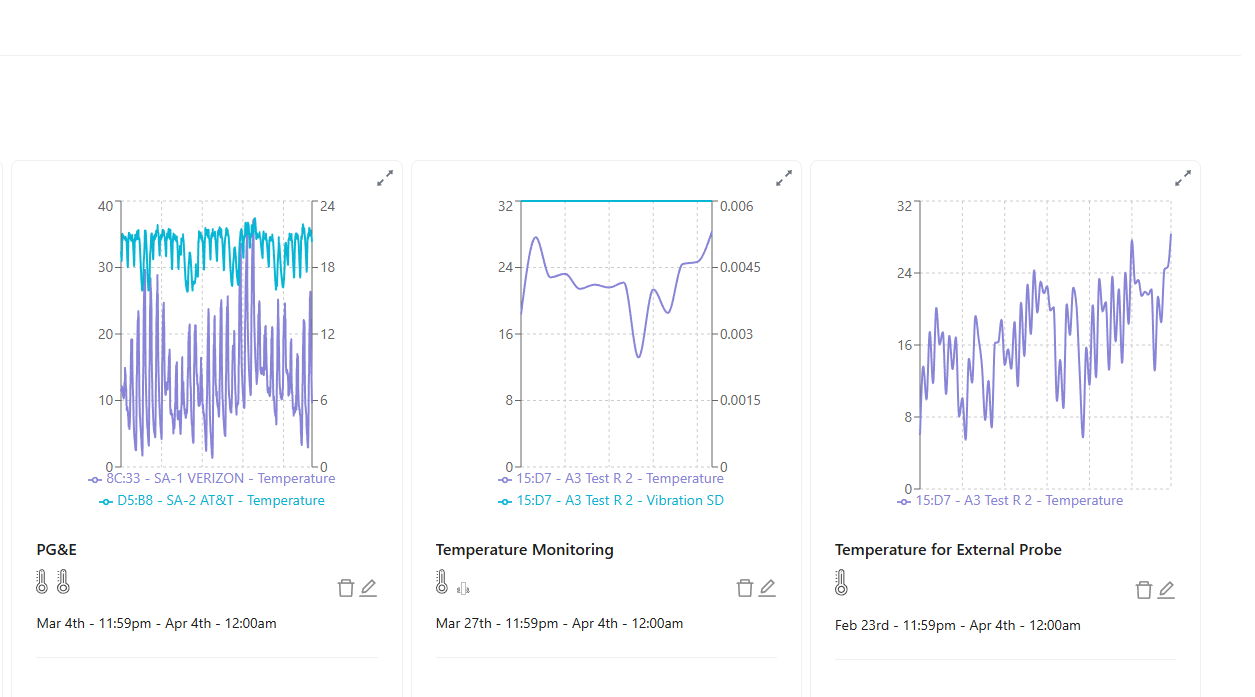
Navigate to the Insights tab
Click the pencil icon to select devices and sensors to create graphs
Save important graphs to the Overview tab for quick access
Previous Topic
Back to Chapter
Next Chapter